World Intangible Investment Highlights 2025: A Global Shift Toward Intangible Capital

The 2025 edition of the World Intangible Investment Highlights (WIIH), co-published by the World Intellectual Property Organisation (WIPO) and Luiss Business School, confirms a profound transformation in the global economy: intangible investments are now growing far faster than tangible ones. These assets of software, R&D, data, design, brands, and organisational capital have become central to productivity, innovation, and long-term growth strategies.
Intangible Investment Outpaces Tangible by a Wide Margin
Between 2008 and 2024, intangible investment grew 3.7 times faster than tangible investment. In real terms, while tangible investment grew by only 1.1% annually, intangible investment expanded at a compound annual growth rate (CAGR) of 4.1%. From 1995 to 2024, the cumulative growth in intangible investment was 143%, compared to just 32% for tangible assets.
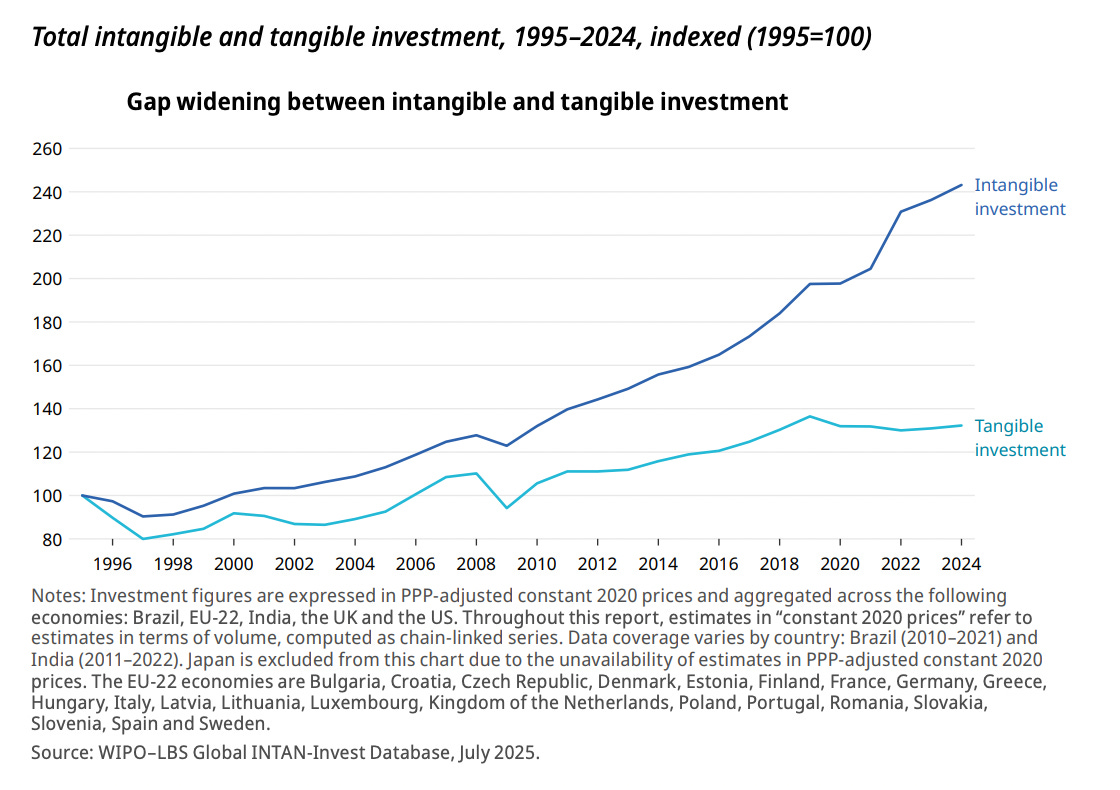
This divergence has sharpened since 2020. Tangible investment stagnated due to tighter monetary policies and macroeconomic uncertainty, while intangible investment continued to rise. In 2024, total intangible investment across key economies (EU‑22, US, UK) reached USD 7.6 trillion in current prices, up from USD 7.4 trillion in 2023, while tangible investment inched from USD 5.08 trillion to USD 5.13 trillion. Overall investment increased by more than 2% in real terms between 2023 and 2024, largely driven by intangibles.
Intangible Investment as a Share of GDP: Now the Dominant Force
Intangible investment’s share of GDP has risen steadily from 10% in 1995 to nearly 14% in 2024, overtaking tangible investment’s share (which fell from 12% to 11%). This reflects the deep structural transition toward a knowledge-based economy, where intellectual and digital assets drive competitive advantage.
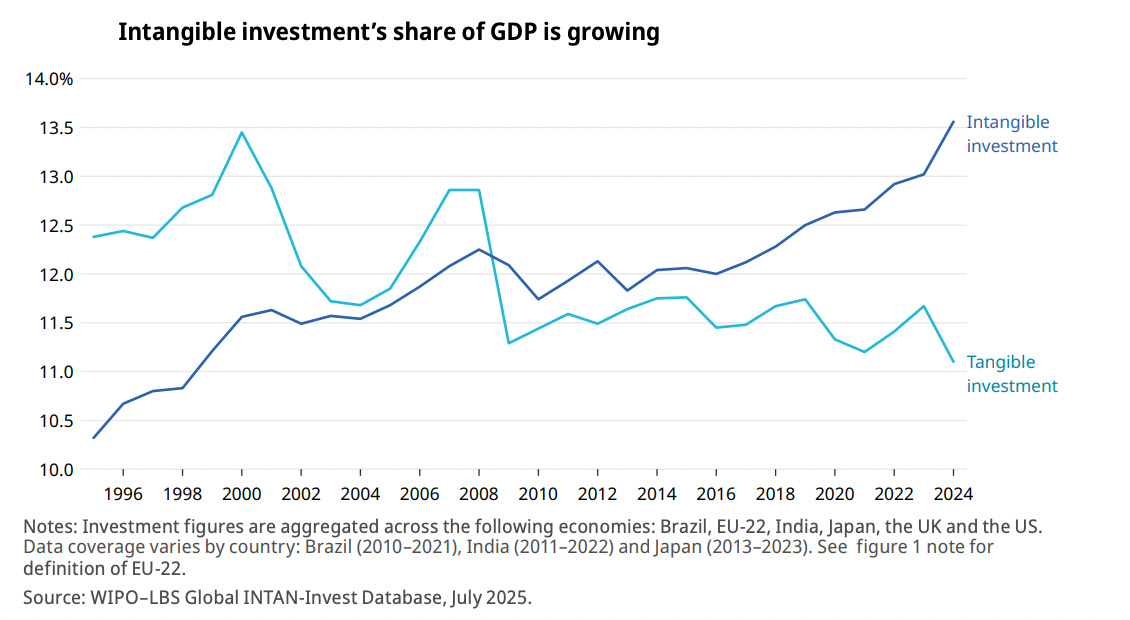
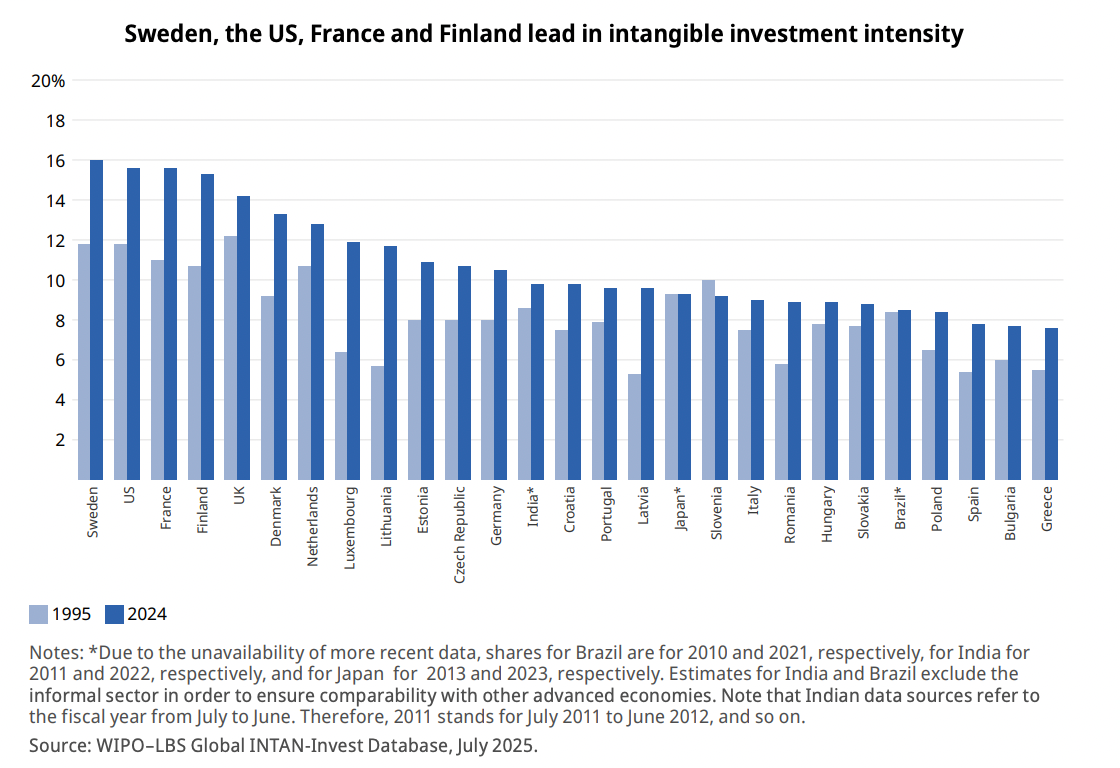
Sweden, the US, France, and Finland lead in intangible investment intensity, with Sweden reaching 16% of GDP in 2024. India’s intensity, at nearly 10%, now surpasses Japan and several European countries. Brazil, at 8.5%, exceeds Spain and Greece.
Global Leaders and Fast Movers
The United States remains the world’s clear leader in intangible investment. In 2024, it invested USD 4.7 trillion in intangible assets, nearly twice the combined total of France, Germany, the UK, and Japan. France surpassed Germany and Japan in 2024, with over USD 631 billion in intangible investment, growing more than 5% year-on-year. Germany stood at USD 602 billion, and Japan at USD 597 billion (2023 data).
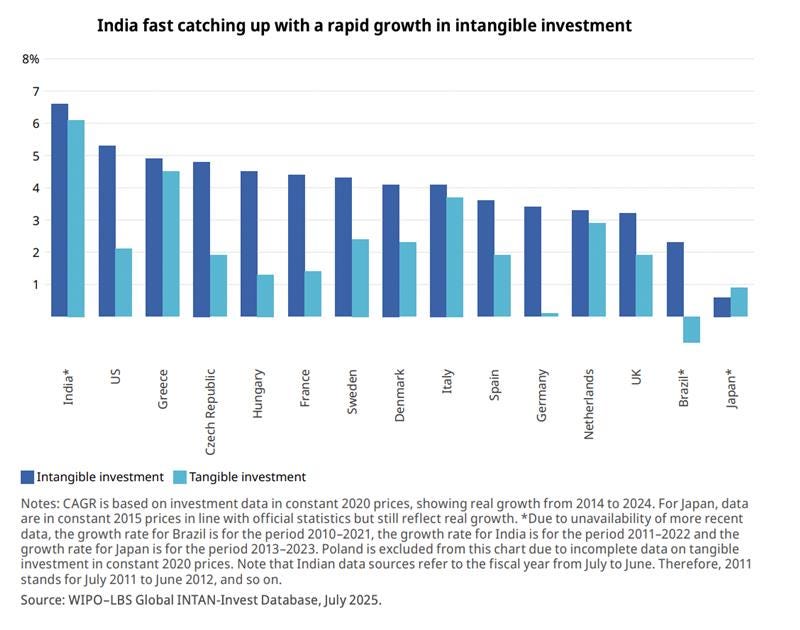
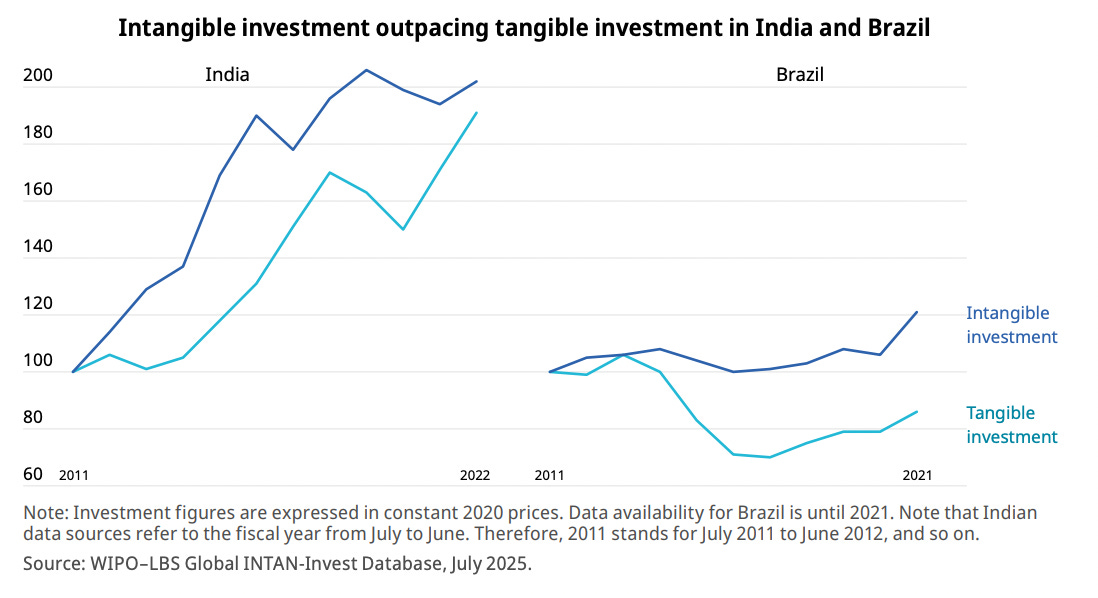
India, though smaller in total volume, posted the fastest growth rate among all countries. Between 2011 and 2022, India’s intangible investment grew at an average annual rate of nearly 7%, outpacing both tangible investment and all other major economies. For comparison, the US followed at over 5% growth from 2014 to 2024, while France, Germany, the UK, and Sweden saw 3- 4.5% annual growth. Brazil’s intangible investment grew at over 2% from 2010 to 2021, while its tangible investment declined.
India: Fastest-Growing Intangible Investment Economy
Among all economies covered in the WIIH 2025, India stands out as the fastest-growing country in terms of intangible investment. Between 2011 and 2022, India recorded an average annual growth rate of nearly 7%, reflecting a structural catch-up process as it builds intangible capital from a relatively lower base compared to advanced economies.
Both tangible and intangible investments have grown steadily in India since 2011. Between 2011 and 2022, tangible investment grew at about 6% annually, while intangible investment slightly outpaced it. In more recent years, particularly from 2021 to 2022, tangible investment surged by nearly 12%, overtaking intangible investment growth, which stood at around 4%. This suggests that while India continues to expand its intangible asset base, physical infrastructure and capital formation have also gained momentum.
India’s intangible investment intensity, measured as intangible investment as a share of GDP, has increased significantly. In 2022, it was close to 10%, putting India ahead of Japan and several European Union member states, including Spain and Greece. While still trailing global leaders like Sweden (16%), the US, and France (over 15%), this represents a significant step forward in India’s transition to a knowledge- and innovation-driven economy.
India’s intangible investment profile is distinctly weighted toward software and databases, which accounted for more than 50% of its total intangible investment in 2022. This is the highest share among all countries analysed in the report, substantially above Sweden (26%), Brazil (23%), and France (22%). This pattern aligns with India’s global reputation as a digital and IT services powerhouse, with strong capabilities in software development, data analytics, and digital infrastructure.
Other categories of intangible assets, such as brands, R&D, design, and organisational capital, play smaller roles in India’s current mix. For instance, brands make up only 10% of India’s intangible investment, compared to 25% in the UK and Brazil, and 12% in the US. Organisational capital, a dominant category in countries like the US (35%) and France (33%), is less emphasized in India. This suggests scope for diversification and deeper institutional investment in non-digital intangible assets.
It’s important to note that the data for India do not include the informal sector, which remains a significant part of its economy. As a result, current estimates likely understate the full scope of intangible investment. Nevertheless, the report marks India’s inclusion and updated estimates (up to 2022) as a major achievement, supported by contributions from NITI Aayog, the Ministry of Statistics and Programme Implementation, and India’s Permanent Mission to the UN in Geneva.
Asset Composition: What Intangibles Are Growing Fastest?
Organizational capital made up the largest share of intangible investment globally in 2022, accounting for 30% of the total, followed by R&D (22%), software and databases (18%), brands (15%), and design (10%). This breakdown highlights how firms increasingly prioritize internal capabilities, innovation, and digital assets.
Country-specific data reveal key patterns. India leads in software and database investments, with over 50% of its intangible investment concentrated in this area, far ahead of Sweden (26%) and France (22%). The US allocates the largest share to organisational capital (35%), while Japan and Germany emphasise R&D (37% and 32%, respectively). Brazil and the UK invest heavily in brands, each dedicating about 25% of their intangible investment to this asset type.
Sectoral Highlight: AI as a Driver of Both Tangible and Intangible Investment
The report’s special theme focuses on how artificial intelligence (AI) is reshaping investment patterns. AI is prompting two distinct waves: an initial infrastructure build-up (tangible investment in data centers, chips, energy grids) and a longer-term transformation driven by intangibles (software, data, organizational change).
In the US, tangible investment in AI infrastructure surged in 2023 and 2024, as major tech companies, including Amazon, Google, Microsoft, NVIDIA, and OpenAI, poured capital into data centers, semiconductors, and AI-specific hardware. At the same time, intangible investment into software and databases remained the fastest-growing category, expanding over 7% annually from 2013–2022, and over 9% from 2021–2022 alone.
Investment in brands and design also jumped significantly in 2022, growing by 12% and 10%, respectively. These reflect how firms are positioning themselves around AI-driven products and services.
AI-producing sectors focus on R&D, IP, training data, cloud platforms, and brand-building. AI-using sectors embed AI into products, develop smart infrastructures, and invest in workforce training and digital transformation. These dual pathways, hardware and know-how, are creating a distinctive AI investment pattern.
Cross-Country Patterns: Advanced vs Emerging Economies
In advanced economies like the US, France, and Germany, intangible investment has not only overtaken tangible but is expanding the gap. In countries where tangible assets still dominate, like Spain and Italy, the gap is narrowing as intangible investment grows faster.
Japan presents a unique case: historically favoring tangible investment, but since 2020, its intangible investment has begun to catch up. Between 2020 and 2023, Japan’s intangible investment grew at 1.2% annually, compared to 0.6% for tangibles.
In India, tangible and intangible investments both grew steadily from 2011 to 2022. However, the latest data show that tangible investment grew faster in 2021–2022 (nearly 12%) compared to intangible investment (4%), suggesting a temporary resurgence in physical capital formation.
Measurement and Data Challenges
Despite the rising importance of intangible assets, over 60% of global intangible investment remains unmeasured in official national statistics. Categories like branding, design, and organisational knowledge often fall outside standard accounting frameworks.
The WIPO–LBS initiative aims to bridge this data gap. Their Global INTAN-Invest Database now provides annual and quarterly estimates for 27 economies, covering more than half of global GDP, with expanded coverage for Brazil, India, and Japan.
Conclusion: A Strategic Shift Is Underway
The global economy is undergoing a silent revolution. As investment in intangibles, especially software, data, and organisational capital, outpaces physical capital, countries that can cultivate and measure these assets effectively will be best positioned for long-term growth, innovation, and resilience.
India’s rapid rise, the US’s continued dominance, and Europe’s broad transformation all suggest that this is no longer a marginal trend. Intangible capital is now the core engine of economic dynamism. But without accurate measurement, much of it remains invisible to policymakers and markets. Closing this gap is essential for informed investment, smarter policy, and sustainable development.
Access full copy of highlight at https://www.wipo.int/edocs/pubdocs/en/wipo-pub-rn2025-8-en-world-intangible-investment-highlights.pdf