Mapping Global Innovation: An Analysis of WIPO’s GII 2025 Cluster Rankings

The World Intellectual Property Organisation (WIPO) has released its Global Innovation Index (GII) 2025 cluster rankings, offering a detailed look at where the world’s most concentrated hubs of innovation are located. These clusters, defined by high densities of patent filings, scientific publications, and now venture capital (VC) activity, represent the “beating heart” of global innovation. Together, the top 100 clusters account for nearly 70 percent of global PCT patent filings, a similar share of VC deals, and almost half of all scientific publications. Concentration is particularly striking at the top tier: the ten leading clusters alone generate 40 percent of patent filings, 35 percent of VC deals, and over 15 percent of scientific papers worldwide.
What makes this year’s ranking especially significant is a methodological change. For the first time, WIPO has incorporated venture capital deal data alongside patent and publication activity. The intention is clear, measuring innovation cannot rest solely on knowledge creation; it must also capture entrepreneurial dynamism and financial backing.
A New Lens on Innovation
Previous editions of the GII relied on two main measures: the addresses of inventors listed in published Patent Cooperation Treaty (PCT) applications, and the locations of authors of scientific publications. For 2025, WIPO added a third dataset: venture capital deal counts drawn from PitchBook, covering the period 2019 to 2023. The final dataset is immense. It includes 1.3 million PCT applications (with 4.2 million inventor addresses), 8.2 million scientific articles (28.5 million author addresses), and 236,046 VC deals across 66,755 locations.
Using a geospatial clustering method, WIPO identified 237 candidate clusters, later refined to the top 100. VC data was mapped onto these regions after the fact, ensuring that clusters remained geographically meaningful rather than distorted by the sometimes scattershot geography of investment. The result is a clearer, more holistic picture of global innovation ecosystems.
The Global Top Ten
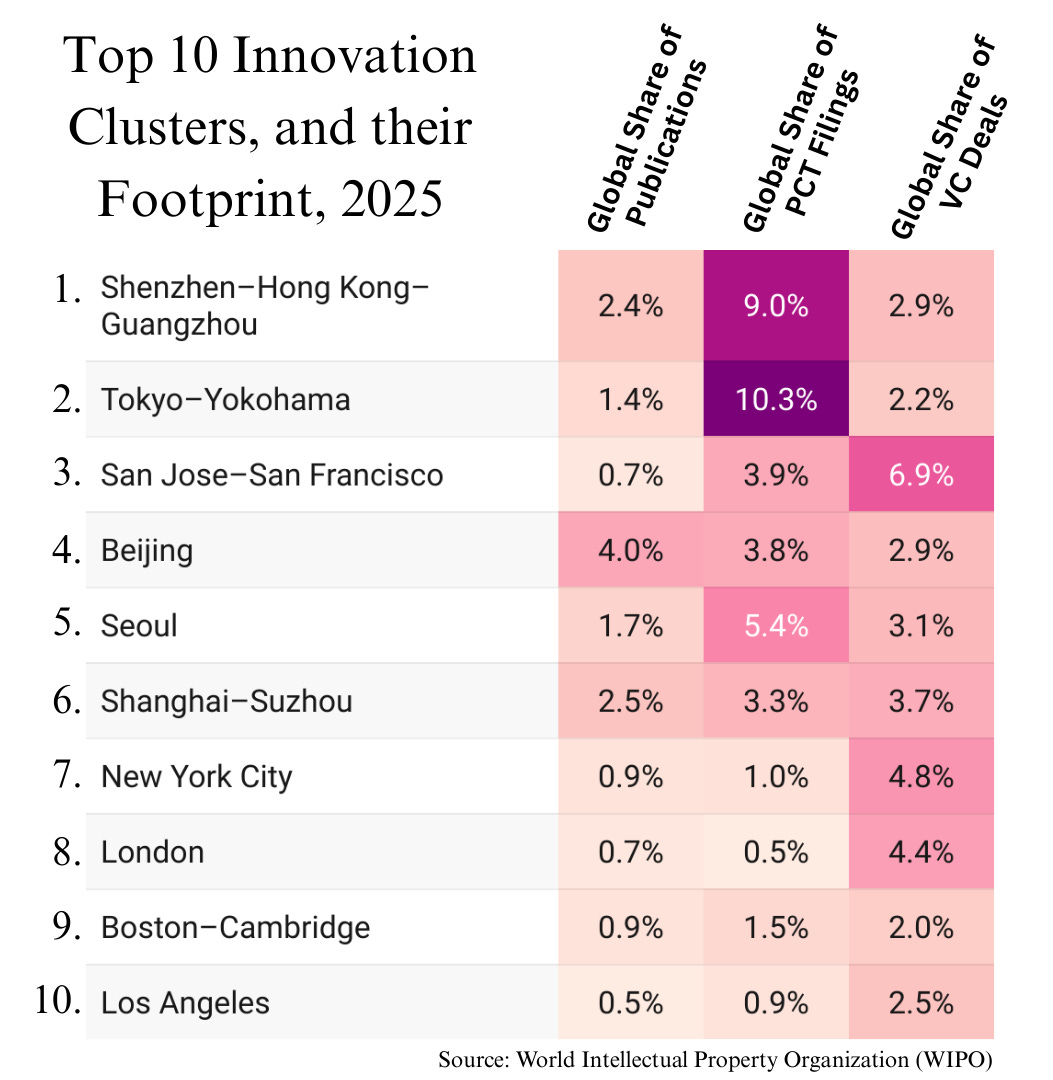
The 2025 list is led for the first time by Shenzhen–Hong Kong–Guangzhou, overtaking Tokyo–Yokohama. The Chinese–Hong Kong cluster filed 117,542 PCT applications between 2020 and 2024, representing 9 percent of the world’s total. It also produced 193,635 scientific publications (2.4 percent) and logged 6,916 VC deals (2.9 percent). Tokyo–Yokohama remains dominant in patents with 135,129 applications (10.3 percent of the global share) but lags behind Shenzhen in venture funding.
Third place goes to San Jose-San Francisco, the United States’ Silicon Valley, which demonstrates unparalleled strength in venture financing. It recorded 16,296 VC deals between 2019 and 2023, accounting for 6.9 percent of the world’s total, alongside 50,813 PCT filings and 56,510 publications. Beijing ranks fourth, topping the global list for scientific output with 331,874 publications (4.1 percent of the world’s share), combined with 49,792 patents and 6,727 VC deals. Seoul, in fifth place, remains a powerhouse of patenting, with 71,318 applications (5.5 percent), as well as 142,509 scientific papers and 7,376 VC deals.
The rest of the top ten includes Shanghai–Suzhou (6th), New York City (7th), London (8th), Boston–Cambridge (9th), and Los Angeles (10th). Notably, three U.S. clusters now feature in the top five, reflecting the weight of venture capital in the revised methodology. Conversely, Osaka–Kobe–Kyoto (Japan), San Diego (U.S.), and Nanjing (China) slipped out of the top ten, underscoring the growing role of financing ecosystems in determining global rank.
Regional Leaders and National Profiles
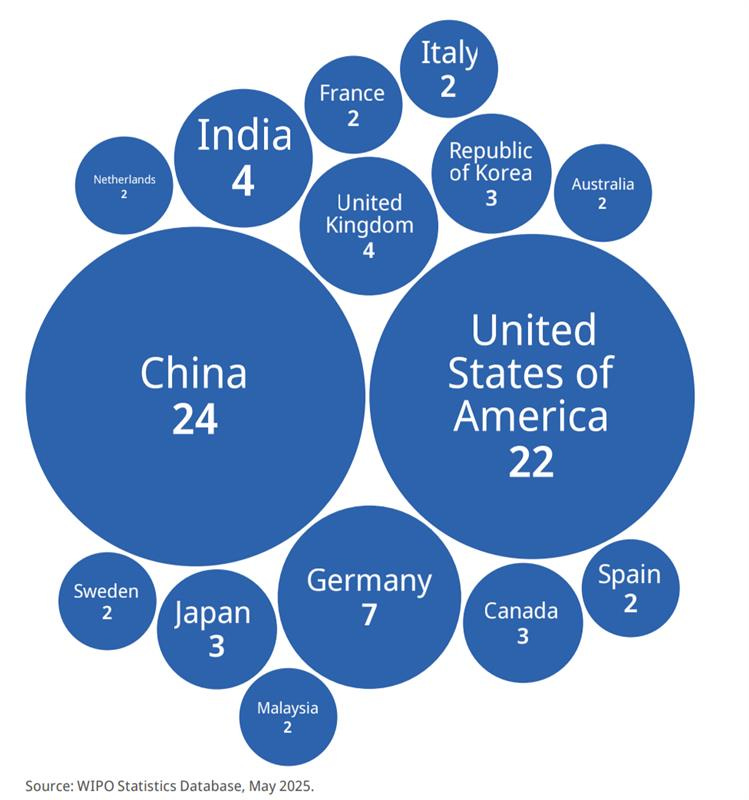
China and the United States continue to dominate the innovation landscape. China leads with 24 clusters in the top 100, although this is down from 26 last year. The United States follows closely with 22 clusters, an increase of two. The inclusion of VC deal data has helped narrow the gap between the two, given the U.S.’s stronger startup financing networks.
Europe holds its position but shows some slippage in rankings. Germany has seven clusters, led by Munich (27th) and Berlin (30th). The United Kingdom now has four, with London at 8th joined by Cambridge (69th), Oxford (77th), and Manchester (94th), a new entrant. France has two clusters in the top 100, with Paris (12th) and Lyon (90th), though Basel, a cross-border cluster shared with Germany and Switzerland, dropped out.
The Asia-Pacific region is led by Japan and Korea, though both saw slight declines. Japan maintains three clusters: Tokyo–Yokohama, Osaka–Kobe–Kyoto (11th), and Nagoya (28th). Korea also has three: Seoul (5th), Daejeon (25th), and Busan (95th), while Daegu fell out of the ranking.
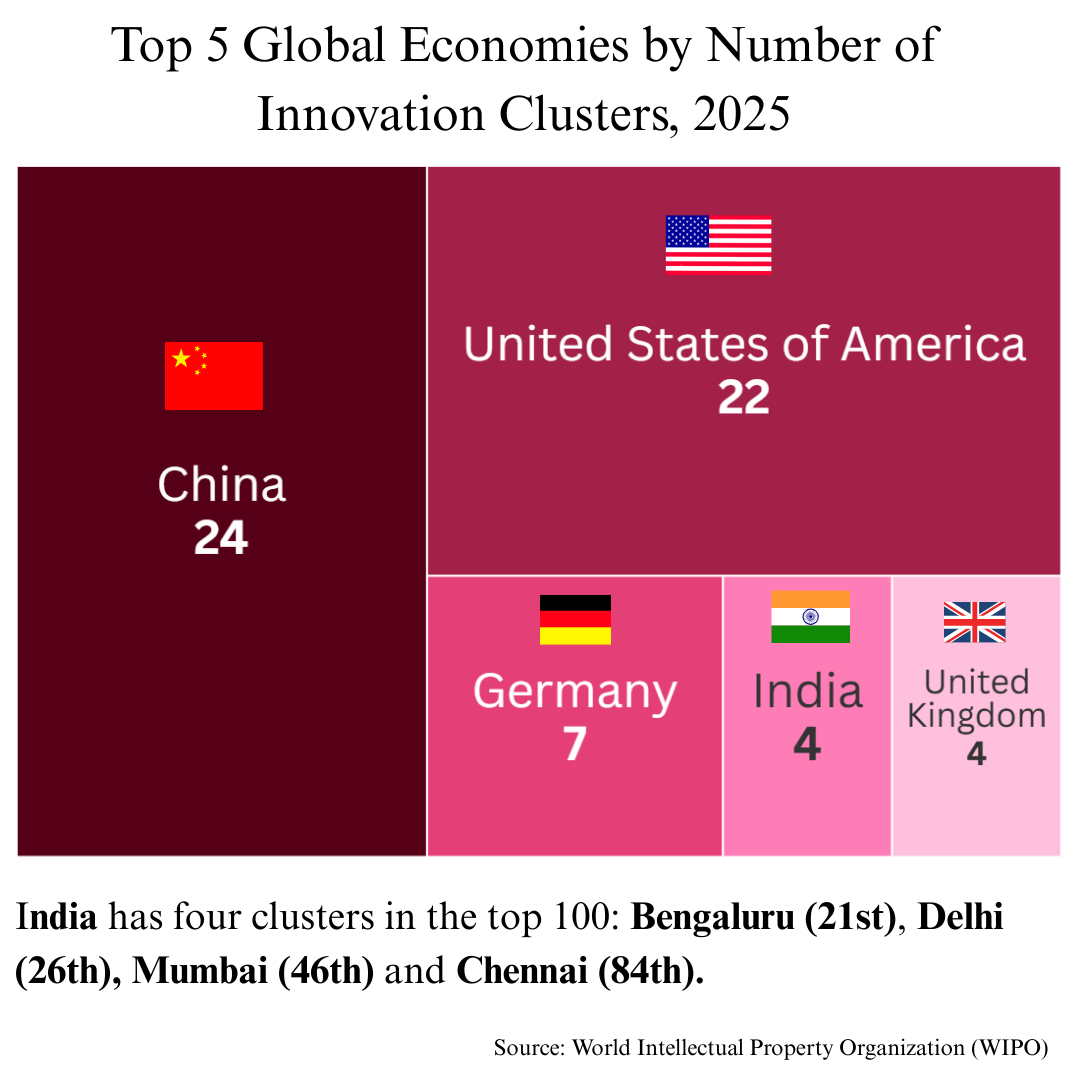
India stands out as a success story. Its four clusters, Bengaluru (21st), Delhi (26th), Mumbai (46th), and Chennai (84th), all improved dramatically under the new methodology. Bengaluru rose from 52nd under the old system to 21st, Delhi from 63rd to 26th, and Mumbai from 88th to 46th. These gains reflect the country’s expanding startup ecosystem and robust venture funding activity. Hyderabad (102nd) and Pune (112th) now hover just outside the top 100, indicating more potential entrants in the near future.
Beyond these established innovation economies, several middle-income countries feature. São Paulo (49th) remains Latin America’s leader, now joined by Mexico City (79th). In the Middle East, Tel Aviv–Jerusalem (19th), Istanbul (58th), and Tehran (63rd) stand out. Cairo (83rd) is the only African cluster in the top 100.
Rising and Emerging Clusters
Ten clusters entered the top 100 for the first time this year, including Miami (67th), Phoenix (78th), and Salt Lake City (92nd) in the United States; Ningbo (93rd) and Ningde (99th) in China; Dublin (71st) in Ireland; Mexico City (79th); Oslo (85th); Hamburg (91st); and Manchester (94th). Their inclusion reflects both performance improvements and the new weight given to venture capital.
WIPO also extends its ranking beyond the top 100 to identify emerging hubs. Riyadh (101st), Hyderabad (102nd), and Lausanne (103rd) are closest to breaking in. Additional clusters include Buenos Aires, Belgrade, Bangkok, Lisbon, and Lahore, pointing to a wider geographic spread of innovation activity.
Innovation Intensity: Leaders Per Capita
In addition to ranking by size, WIPO measures innovation intensity, defined as combined shares of patents, publications, and VC deals relative to population. On this measure, the San Jose–San Francisco cluster leads globally, followed by Cambridge (UK), Boston-Cambridge (US), Ningde (China), and Oxford (UK).
Ningde’s sudden appearance in the top five illustrates how a single firm can propel a region forward. Contemporary Amperex Technology Co. Ltd. (CATL), a global leader in energy storage and battery innovation, has driven a surge in patent activity there. The intensity ranking also highlights clusters like Helsinki (9th) and Eindhoven (10th), underscoring Europe’s continued strength in research-driven ecosystems even where VC markets are less deep.
The Shifting Geography of Innovation
The 2025 rankings make one thing clear: the geography of innovation is evolving. U.S. clusters dominate in venture capital, China remains unmatched in the scale of patents and publications, and India emerges as a fast-rising player thanks to its expanding startup ecosystem. Europe continues to lead in research intensity but often falls behind in commercialization and financing. Middle-income economies, while less represented, are carving out important footholds, from São Paulo to Cairo to Mexico City.
The inclusion of venture capital as a metric brings the rankings closer to the real-world conditions that drive innovation: not just scientific and technical knowledge, but also the funding that allows ideas to reach markets. For policymakers, the message is clear. Building world-class innovation ecosystems requires not just universities and research institutions, but also vibrant financing networks that connect science with entrepreneurship.
Read full Report here: https://www.wipo.int/en/web/global-innovation-index/2025/innovation-clusters